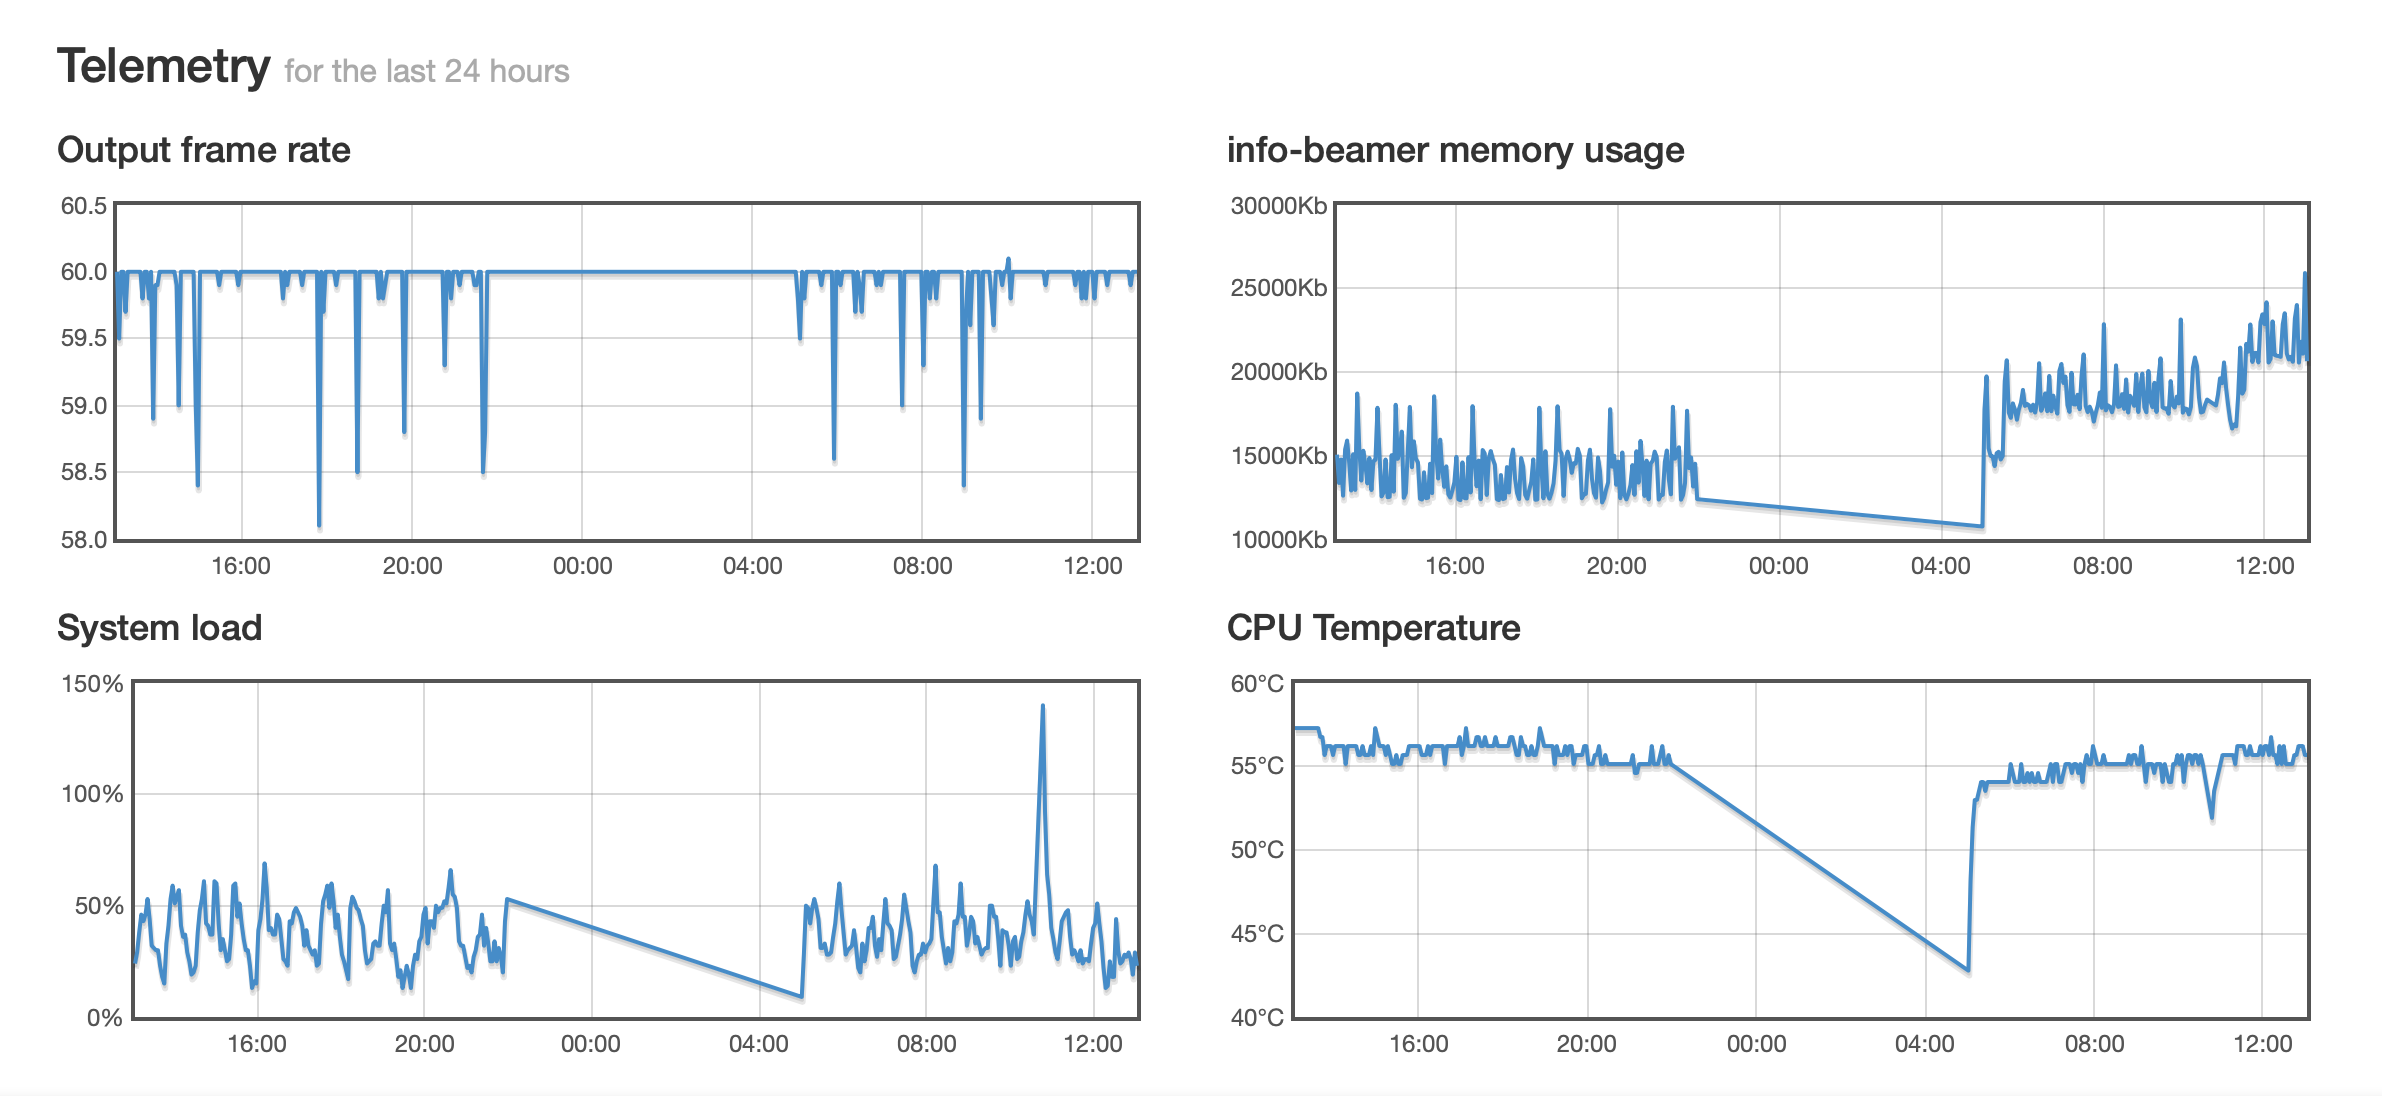
Hi, I have a remote device that has gone offline, having looked at the telemetry data from before it went offline I noticed that the system load, at one point, was reported as approx 140%.
Firstly, I don’t know how this is possible, so maybe just a glitch in the reporting, but also, could this be related to the device now being offline/failed.
Very unlikely and also not a glitch: The system load graph uses the unix system load values: Essentially that means that if one process tries to use 100% CPU, you’ll get a load value of 100%. If two processes both require 100% CPU, the load would be 200%. As most Pis have 4 cores, a load of 400% means that four processes each use all individual cores and none of them would slow down. The spike is probably due to a daily process that checks the integrity of all cached files.